We’ve seen many graphical and animated explainers for the Fourier series. We suppose it is because it is so much fun to create the little moving pictures, and, as a bonus, it really helps explain this important concept. Even if you already understand it, there’s something beautiful and elegant about watching a mathematical formula tracing out waveforms.
[Andrei Ciobanu] has added his own take to the body of animations out there — or, at least, part one of a series — and we were impressed with the scope of it. The post starts with the basics, but doesn’t shy away from more advanced math where needed. Don’t worry, it’s not all dull. There’s mathematical flowers, and even a brief mention of Pink Floyd.
The Fourier series is the basis for much of digital signal processing, allowing you to build a signal from the sum of many sinusoids. You can also go in reverse and break a signal up into its constituent waves.
We were impressed with [Andrei’s] sinusoid Tetris, and it appears here, too. We’ve seen many visualizers for this before, but each one is a little different.
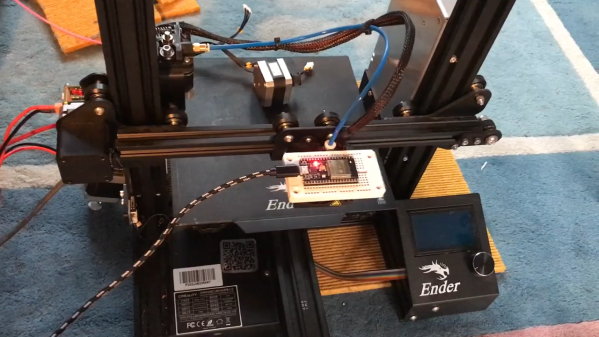
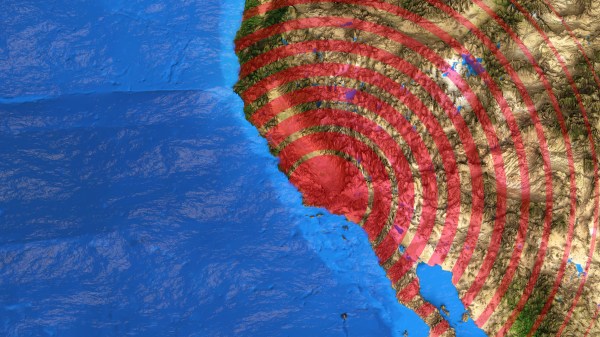
 Granted, based as it is on the gantry of an old 3D printer, [Neumi]’s WiFi scanner has a somewhat limited work envelope. A NodeMCU ESP32 module rides where the printer’s extruder normally resides, and scans through a series of points one centimeter apart. A received signal strength indicator (RSSI) reading is taken from the NodeMCU’s WiFi at each point, and the position and RSSI data for each point are saved to a CSV file. A couple of Python programs then digest the raw data to produce both 2D and 3D scans. The 3D scans are the most revealing — you can actually see a 12.5-cm spacing of signal strength, which corresponds to the wavelength of 2.4-GHz WiFi. The video below shows the data capture process and some of the visualizations.