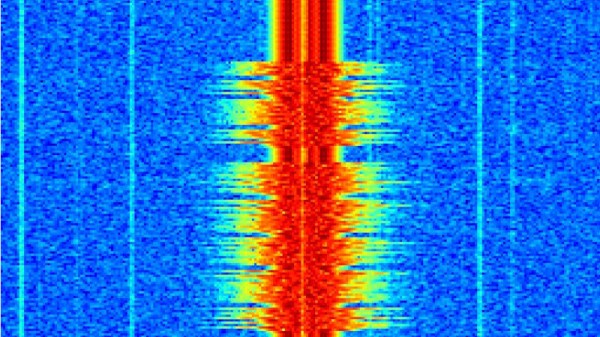
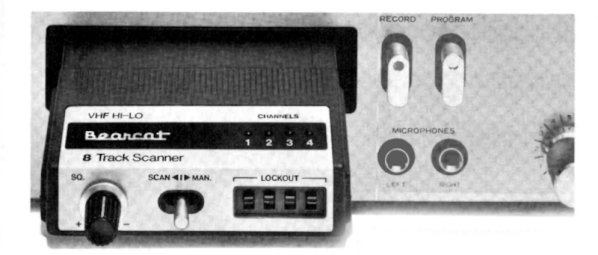
In the old days, scanners would listen to a bunch of channels in a round-robin fashion. If a signal breaks the squelch, the scanner stops and scanning continues scanning after a few seconds of inactivity. But with modern SDRs, you don’t have to listen to one channel at a time. You can listen to all of them. [Tech Minds] shows RTL-SDR Scanner on Linux to record up to 20 MHz of the band simultaneously. It records all the channels in the band of interest. The actual project is on GitHub.
Once recorded, you can use a web interface to listen to the channels and see some statistics about them. [Tech Minds] tried recording aircraft traffic. It worked, but the program doesn’t know how to demodulate AM yet so if you want to record the entire shortwave band, aircraft, or other AM sources, you’ll have to wait a bit before this software is ready for your use case.
If you need to run the program under Windows like [Tech Minds] did, you can use VMWare Workstation Player to get a free copy of Linux on Windows. We wondered if WSL version two might work, too, but we don’t know. Once you have Linux running, Docker makes the installation straightforward. Since the interface is a web interface, you could probably run this on a small computer on the network and then access it at your leisure from another computer.
Of course, old-fashioned scanners were often used to listen to police and fire radios. Those have all gone trunked these days. This isn’t a new idea, but it did seem like a well-packaged solution.

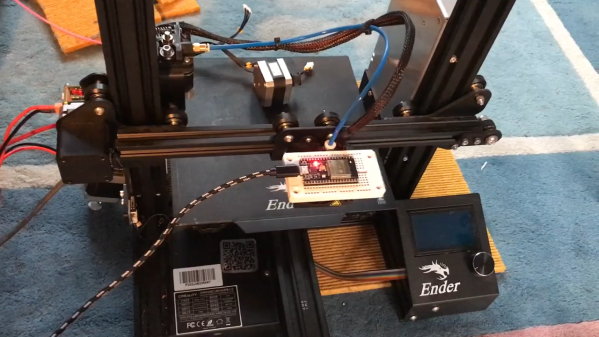
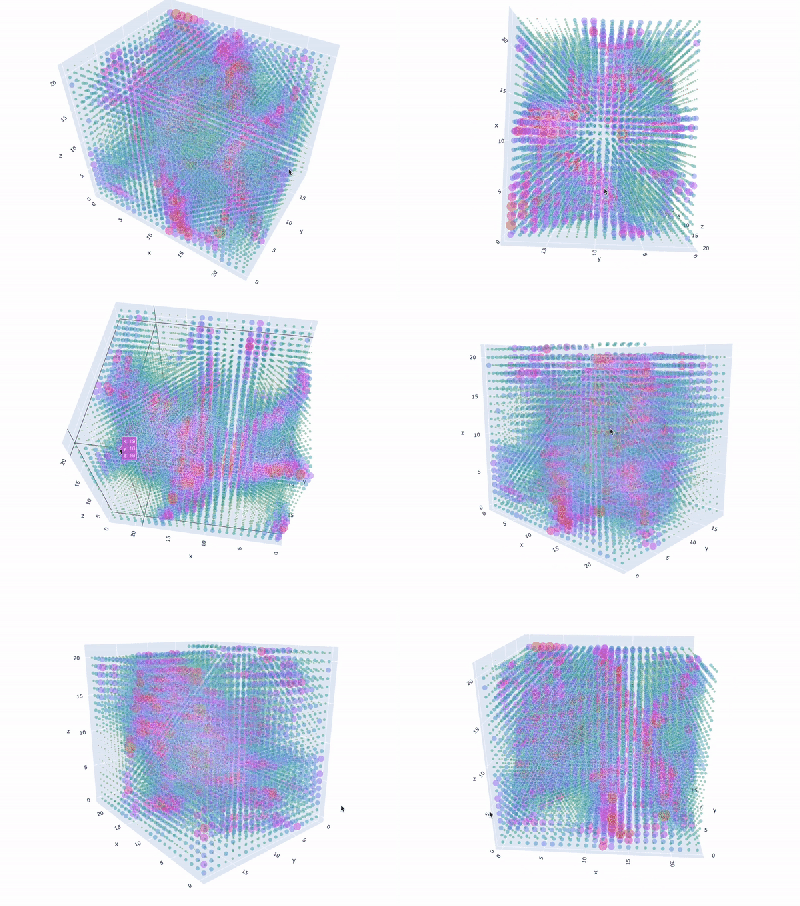 Granted, based as it is on the gantry of an old 3D printer, [Neumi]’s WiFi scanner has a somewhat limited work envelope. A NodeMCU ESP32 module rides where the printer’s extruder normally resides, and scans through a series of points one centimeter apart. A received signal strength indicator (RSSI) reading is taken from the NodeMCU’s WiFi at each point, and the position and RSSI data for each point are saved to a CSV file. A couple of Python programs then digest the raw data to produce both 2D and 3D scans. The 3D scans are the most revealing — you can actually see a 12.5-cm spacing of signal strength, which corresponds to the wavelength of 2.4-GHz WiFi. The video below shows the data capture process and some of the visualizations.